
Dashboard
It is the default home page of your account. You have there a very quick overview of your spending, balance, and results of the day. It is organized by the top sources of traffic (feeds) and campaigns.
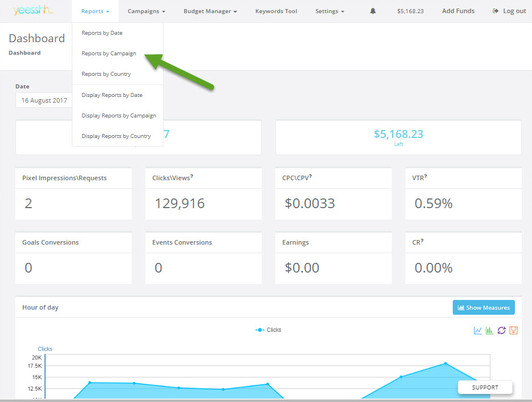
Reports menu let you open stats by a few basic variables. From there, you can drill down further.
Report by Feed (traffic source) and by SubID
Dashboard / Reports / Reports by campaign. Select date range. You see the list of your current campaigns and how they are performing
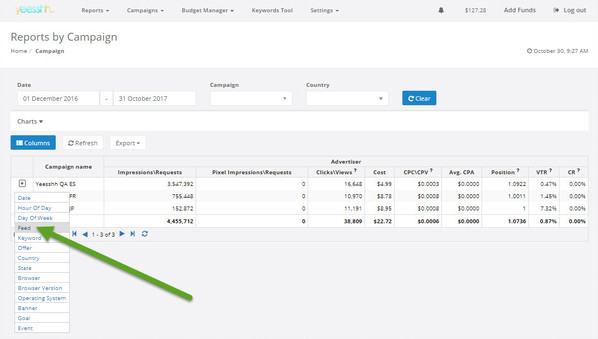
break down the campaign ("+" button) by "Feed" (feed= traffic source)
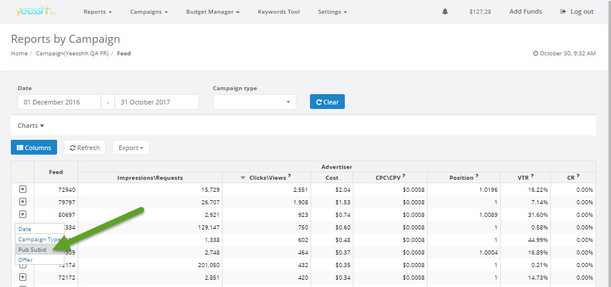
Break down the feed ("+" button) you want by "Pub subid"
Example of reading (from screen shot example)
-
- Traffic source "72540" had 15.729 impressions/requests available for me.
- I won 2.551 Clicks/views (16.22% VTR is a good rate).
- My total cost was $2.04 (because each click was bought at $0.0008 CPC/CPV).
- I was not the best one to bid, as my "position" is 1.0196, meaning other did bid a higher price for this source.
- The CR% is at 0.00% because this campaign is not tracked.
Report by... whatever (BundleID, referer, keyword, OS...)
Dashboard / Reports / Reports by campaign. Select date range. Then break down, clicking on the "+" icon on whatever variable you want
See also:
Definition of terms used in reports